
You will need an IBM Cloud account to do this lab. If you have not created one already, click on this link and follow the instructions to create an IBM Cloud account.
To manage all your projects, you will use IBM Watson Studio. In this exercise, you will add Watson Studio as a Resource.
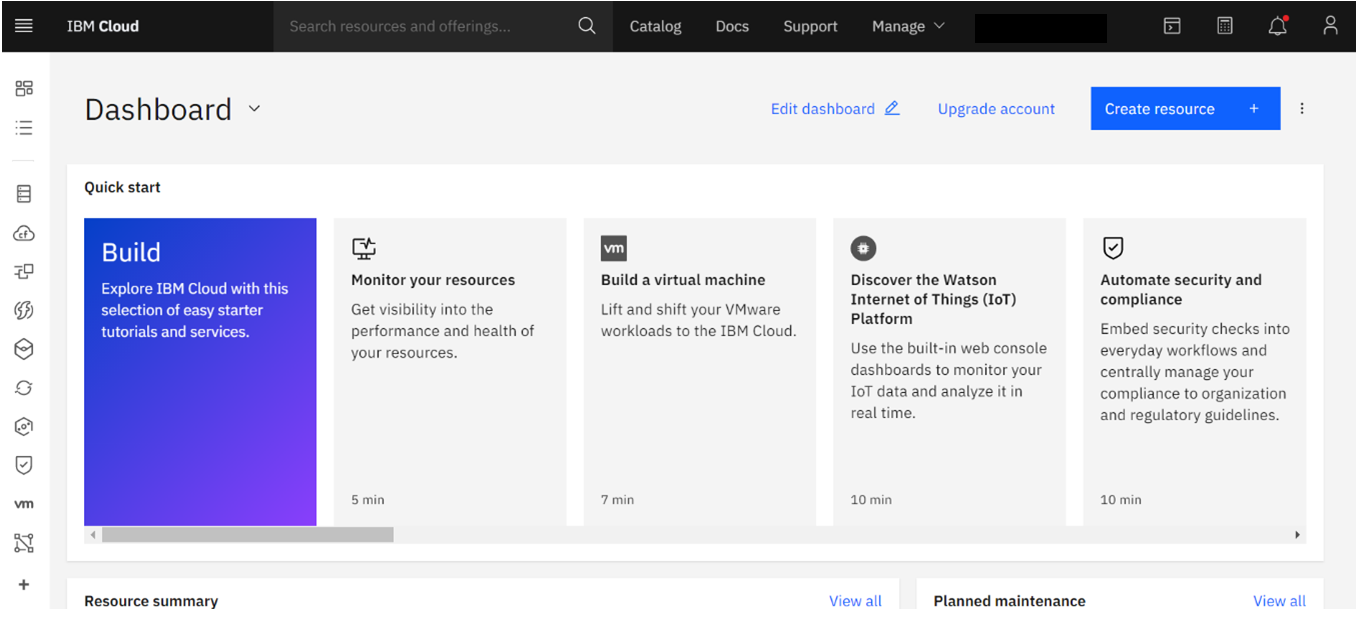
On the Dashboard, click Create Resource.
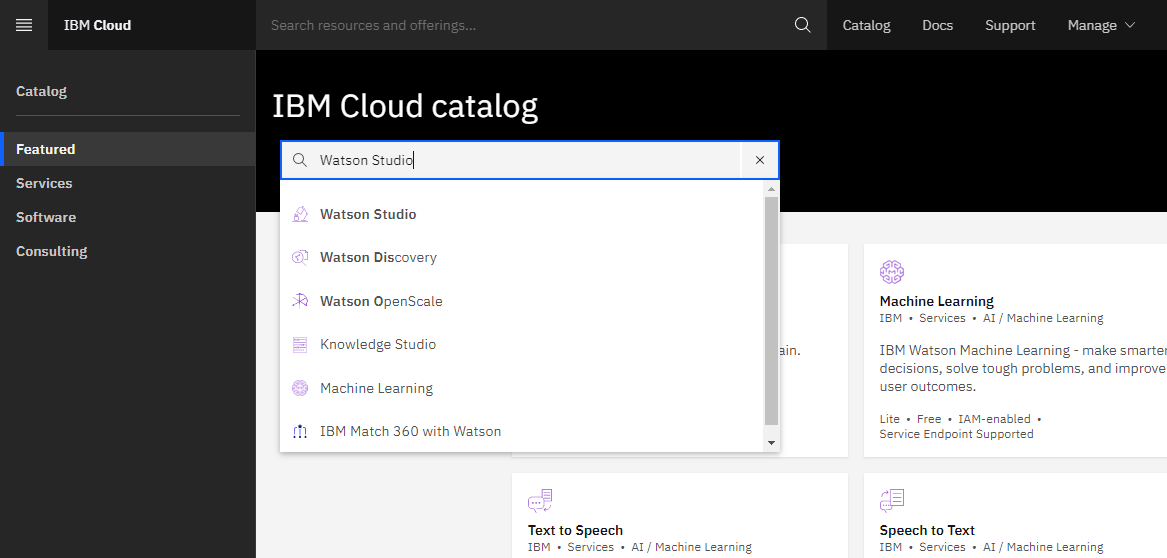
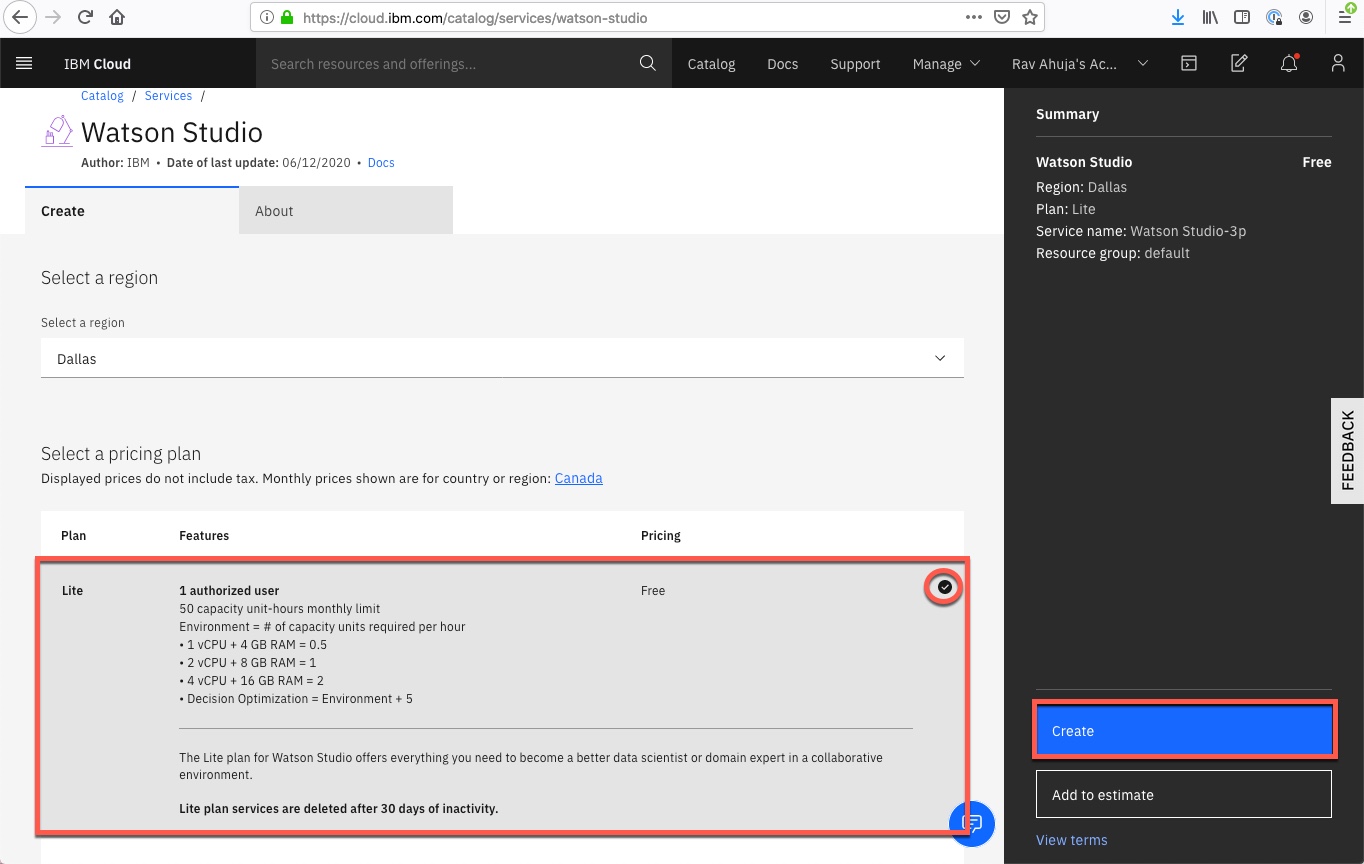
In the IBM Cloud Catalog go to the Watson Studio listing - cloud.ibm.com/catalog/services/watson-studio
To create a Watson Machine Learning instance, click on Create a Project.
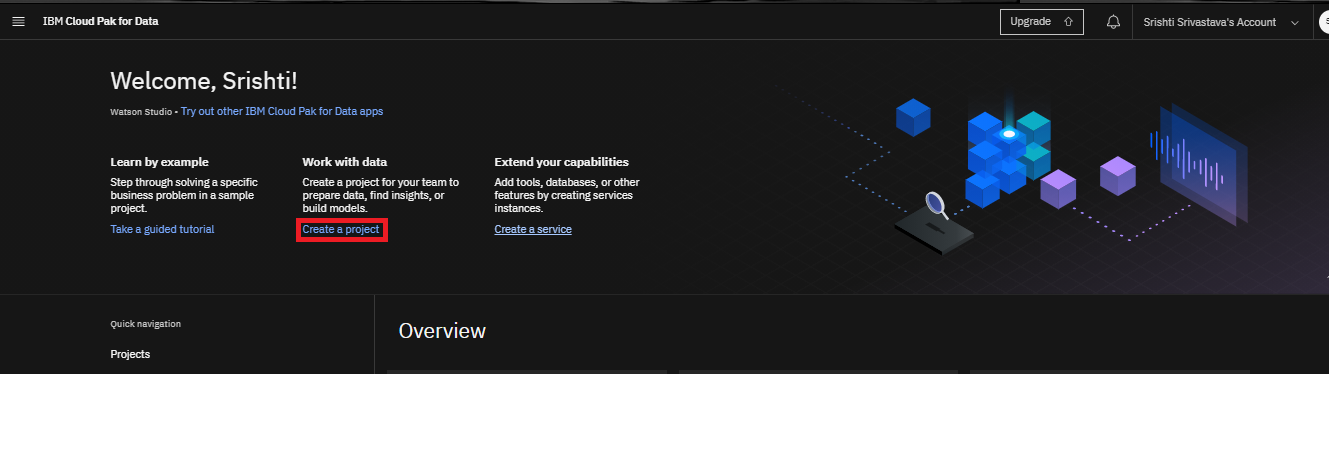
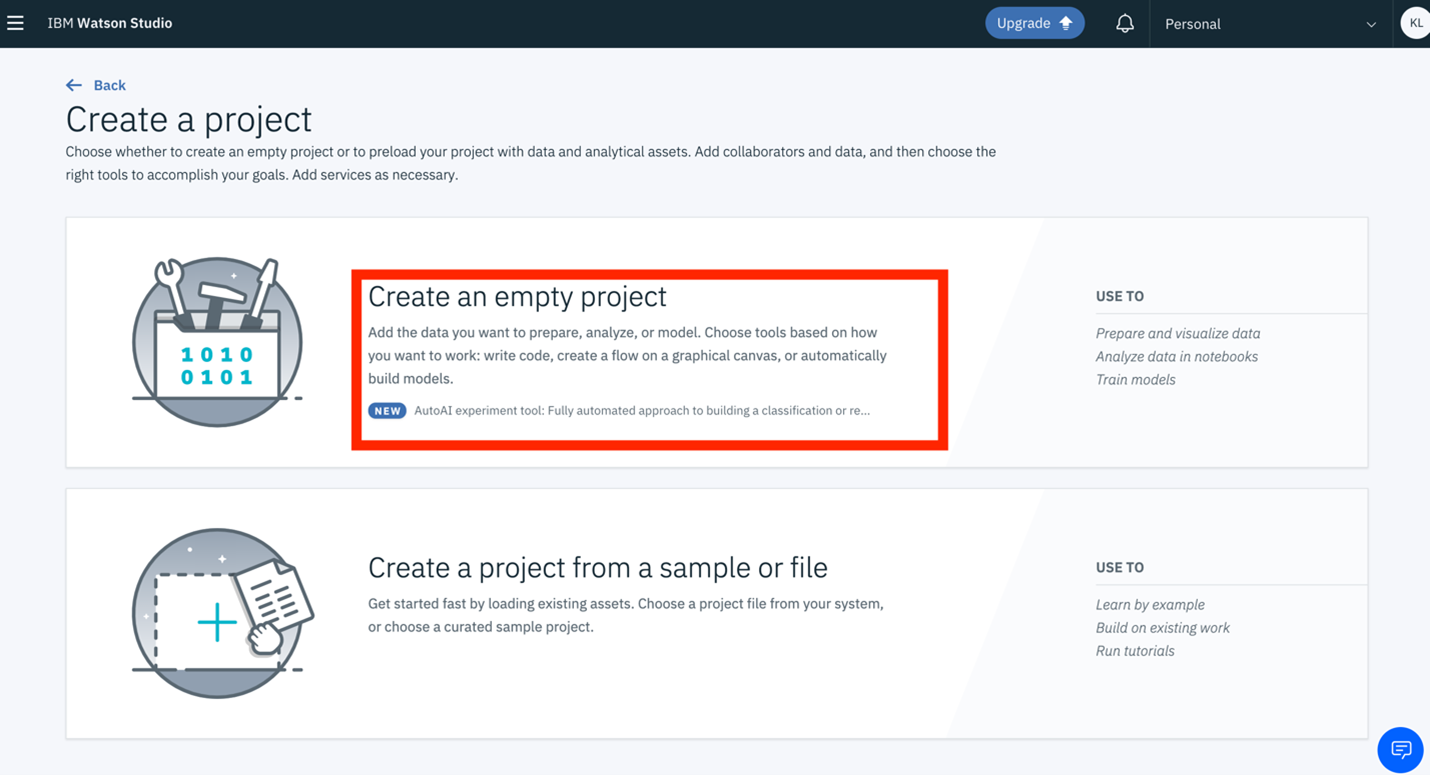
Provide a Project Name and Description.
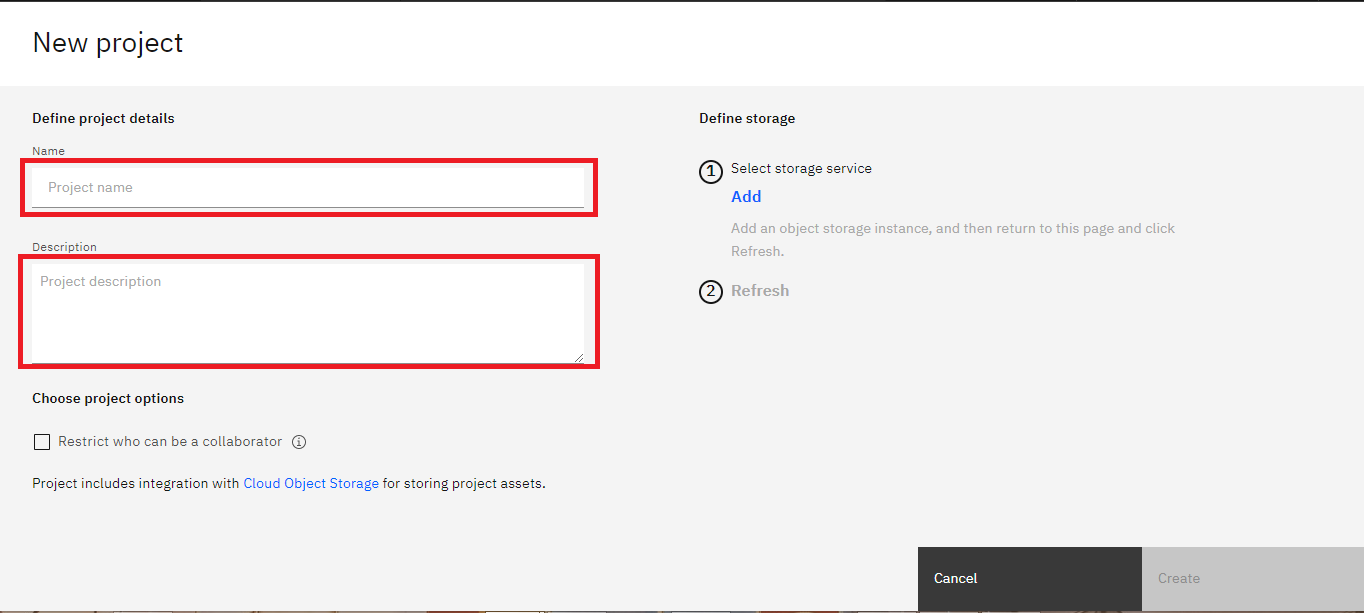
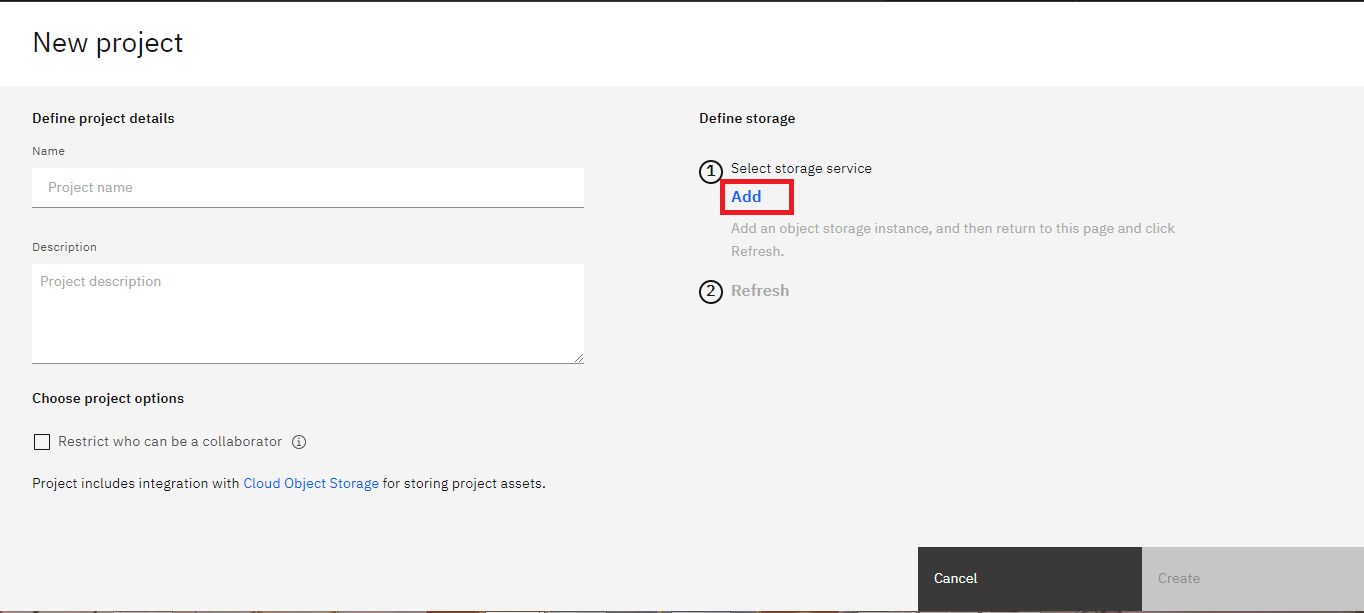
You must also create storage for the project.
Click Add
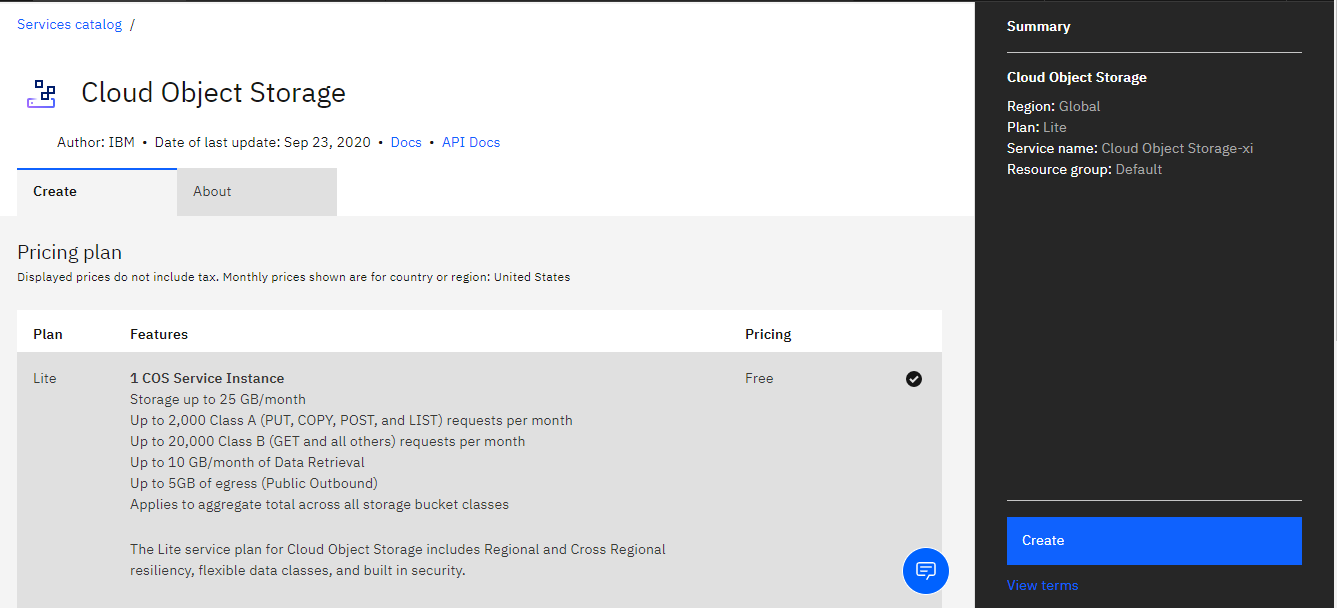
On the Cloud Object Storage page, click Create.
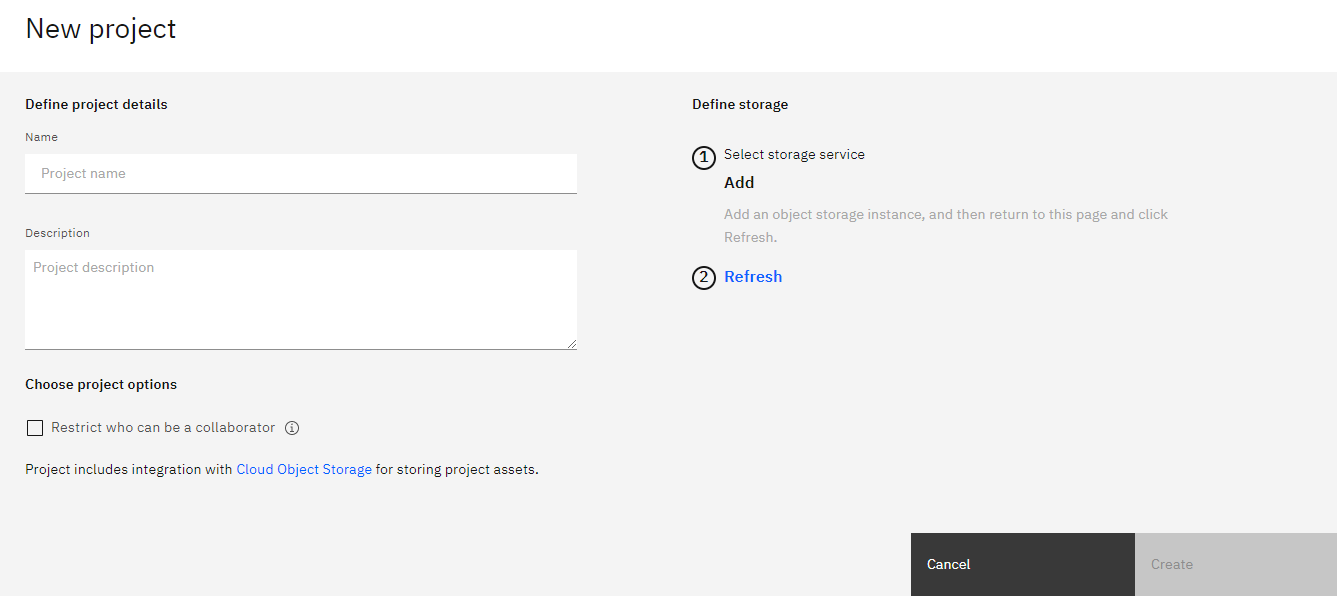
On the New project page, note that the storage has been added, click Refresh and then click Create.
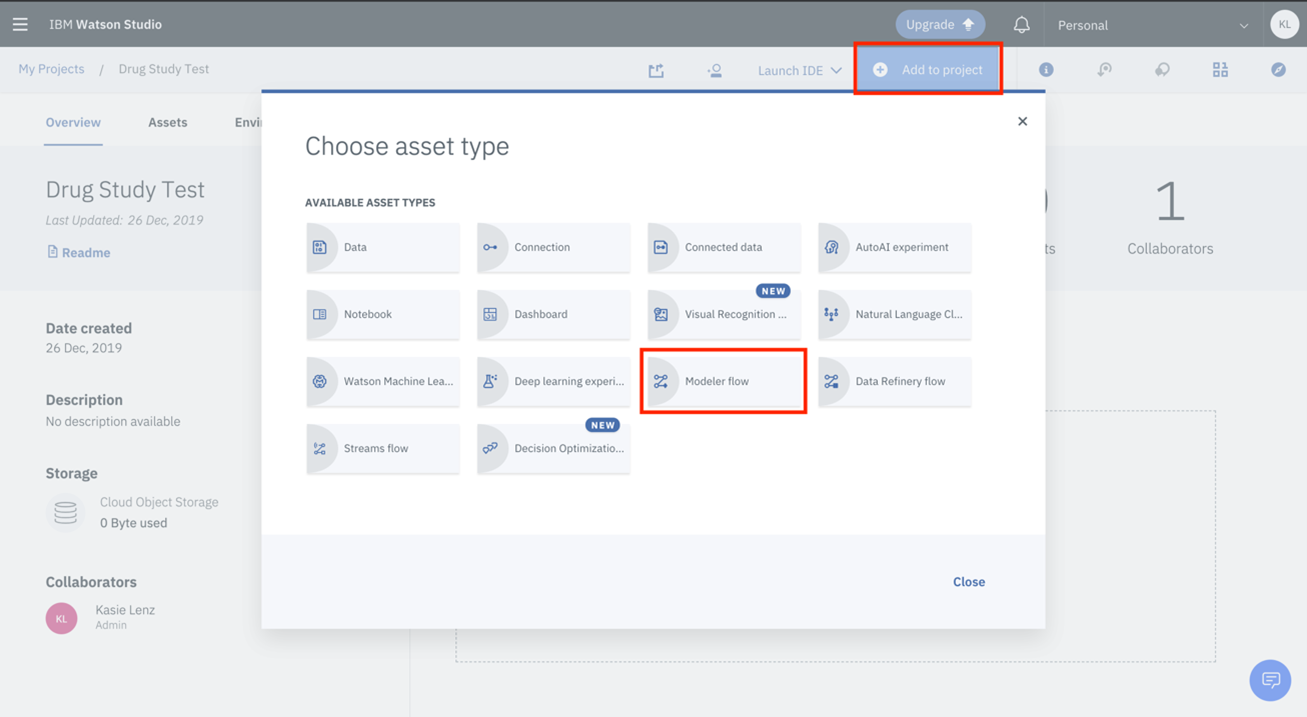
After creating your project, by default, you will land on the Projects page of your project. Click Add to Project.
When the Choose Asset Type box pops up select Modeler flow in the list.
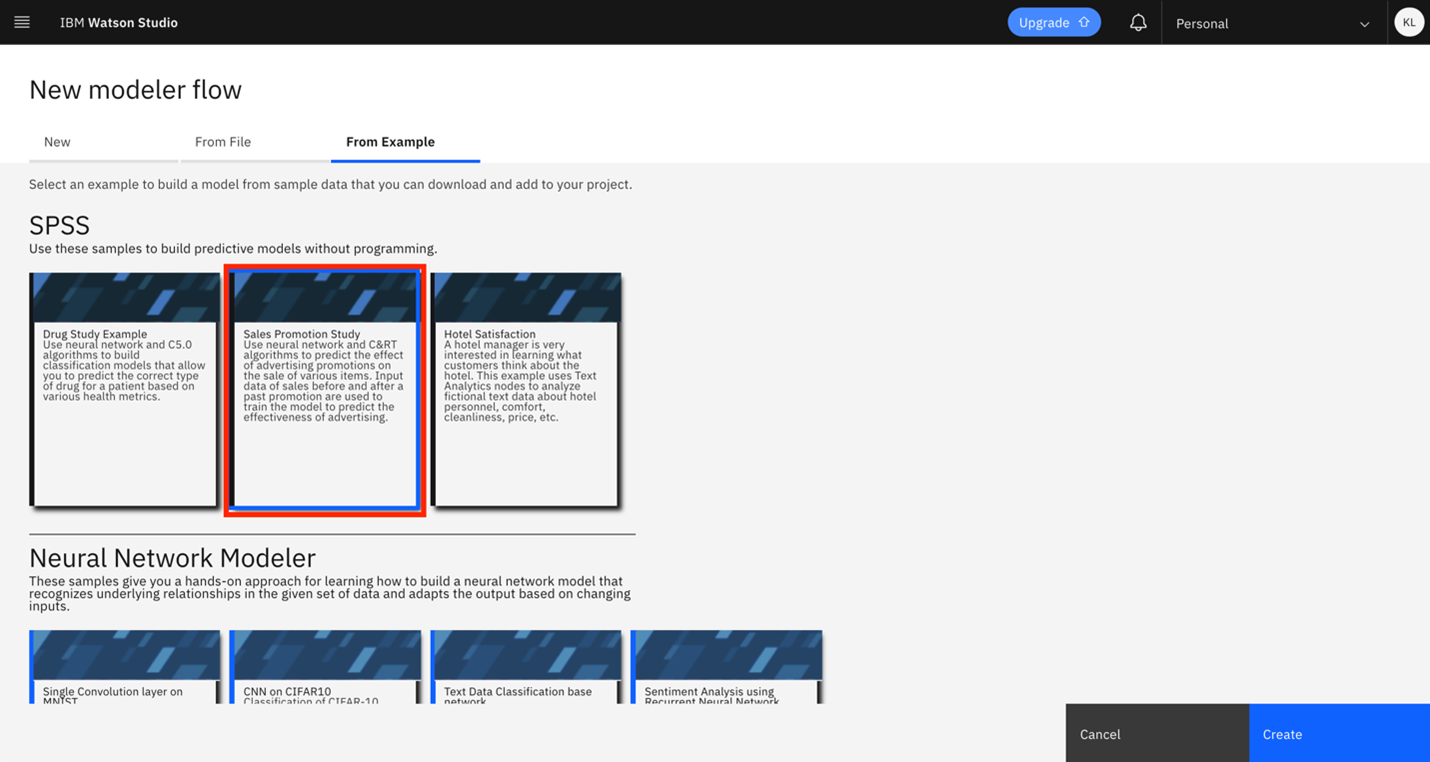
On the next screen, choose From Example, then choose Sales Promotion Study from the options.
After creating your project, by default, you will land on the page where you can view and explore the sales promotion study model.
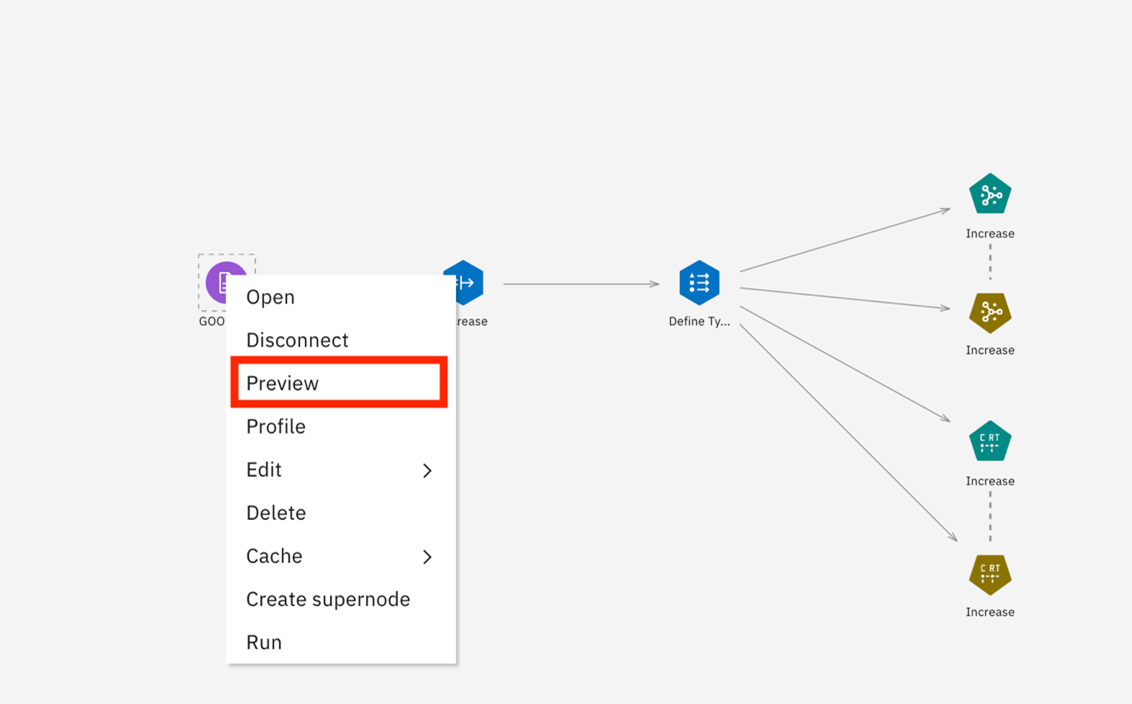
Right-click the purple box labeled Goods1n and then choose Preview.
At this point, you’ve just set up the model flow. It’s a visual representation of the path the data will take and what decisions will be made at each node in order to determine which promotions will lead to an increase in revenue. That is, this is the model that we’ll feed data to in order to get a predictive result. In the next step, you’ll feed the model some sales data and get the result for each one.
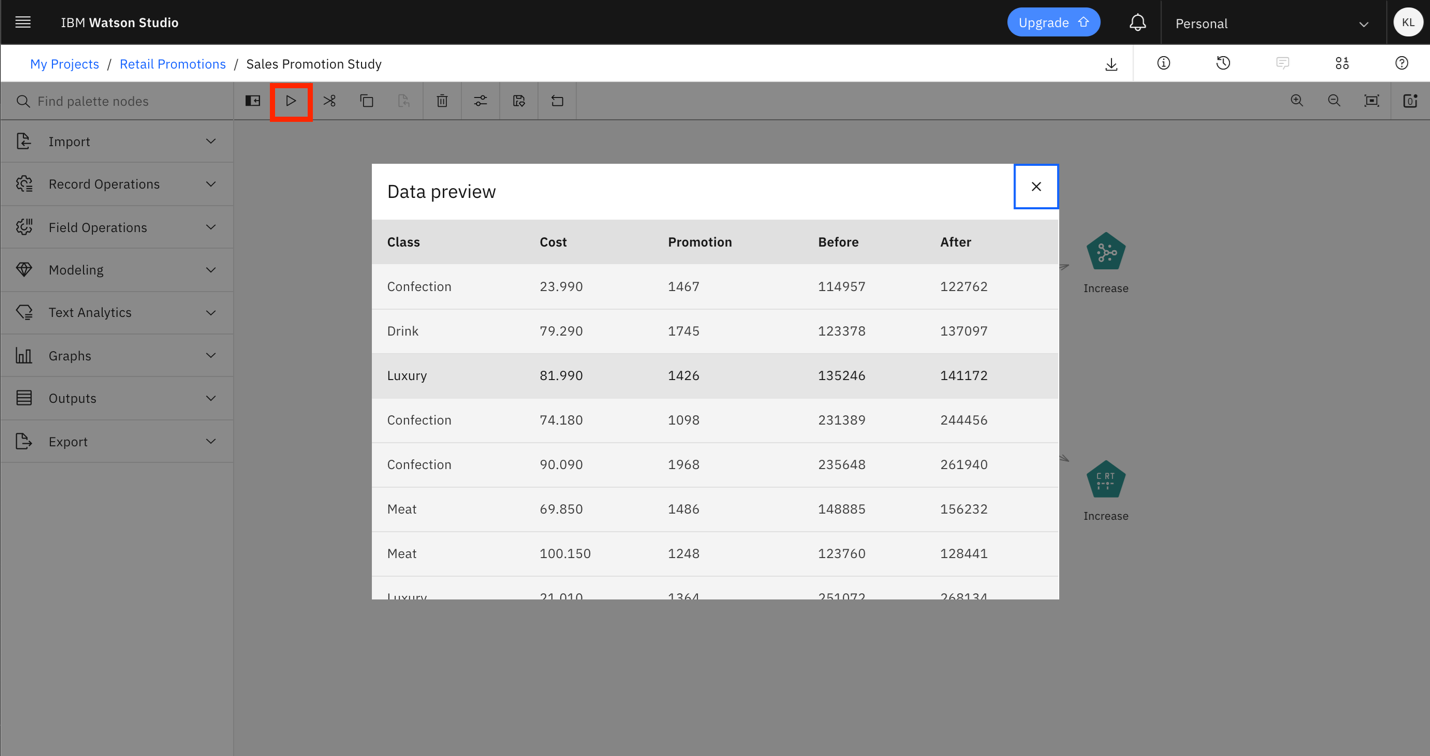
The preview button shows the data set before you run it through the model. Note that this is just a sample of the data and the preview shows just a few rows of the data. The actual data set is much larger. This data set will be used to train the model. Notice there is no prediction about how much of an increase the promotion will make on revenue. We’ll get the result once we run the model.
Now that you’ve explored the model and have begun to understand the underlying data and algorithm, we will run the model to view and analyze the outputs. When you run the models, you will get two outputs: one using a neural network to predict the increase and the other using a classification and regression tree approach. The main difference between regression and a neural network is the impact of change on a single weight. In regression, you can change a weight without affecting the other inputs in a function. However, this isn’t the case with neural networks. Since the output of one layer is passed into the next layer of the network, a single change can have a cascading effect on the other neurons in the network.
Towards the top of the screen, press the Play button, the models should render.
Once you have run the model, machine learning will predict the increase in revenue for each product after each promotion has been applied. Besides the promotion it recommends for each product, it will also give you a percentage increase for each model. You can examine both models to see which predicts the increase with greater accuracy.
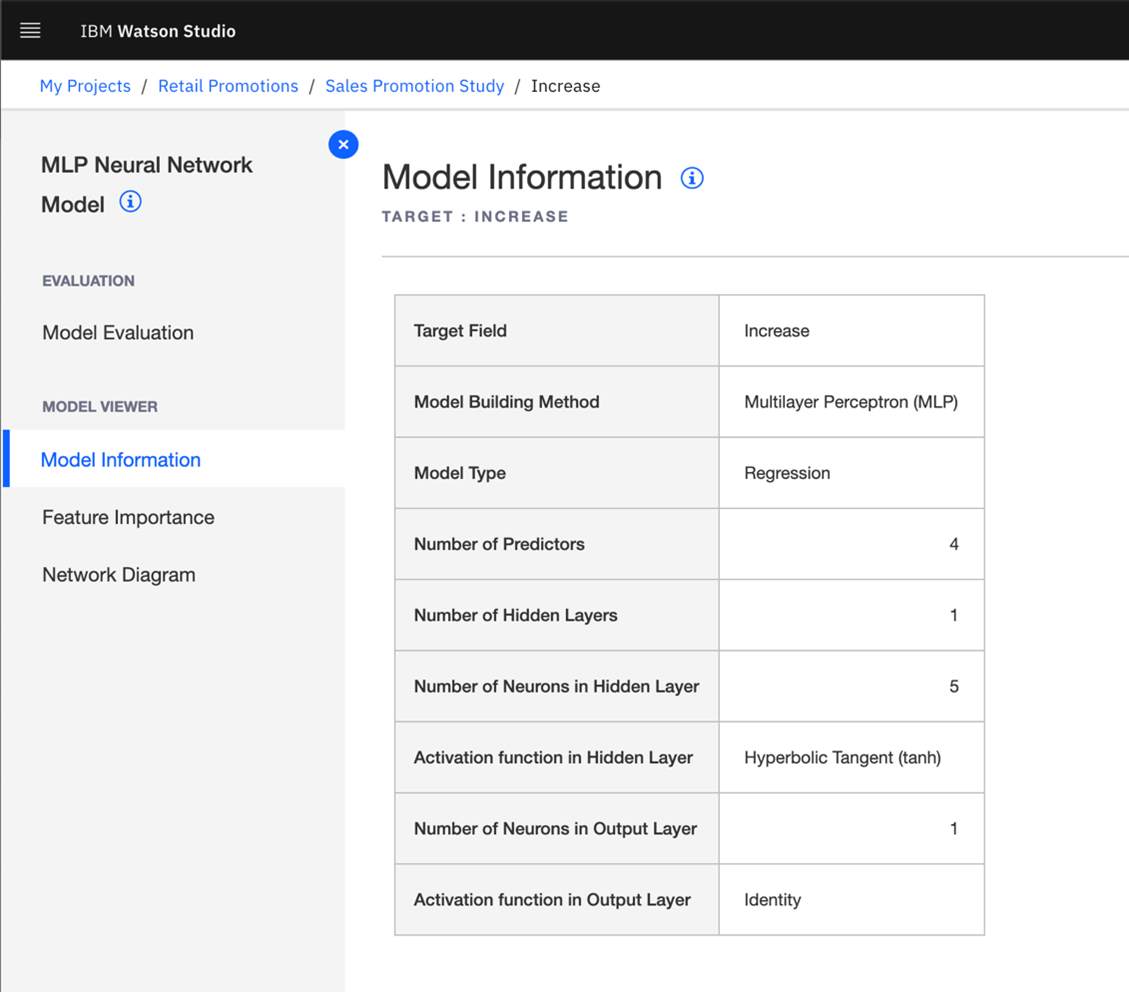
Task 1: Look at the Neural Network model
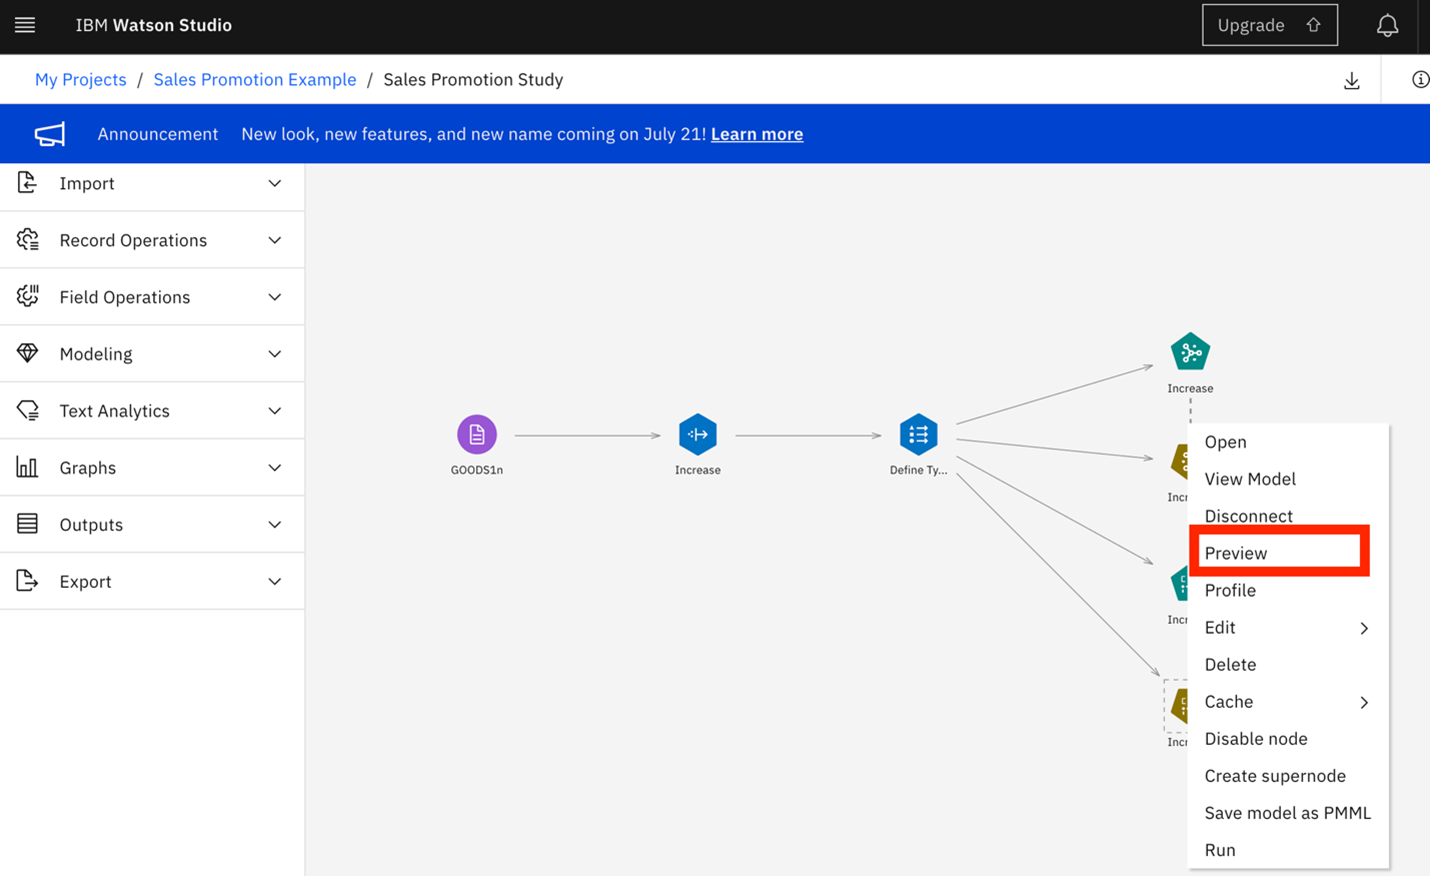
Right click the top brown box called Increase, and click Preview.
Notice the fields labeled Increase and $N-Increase. The Increase column shows the actual percentage increase between the values from before and after the promotion was run (the Before and After columns). The $N-Increase column was created by the modeler using the data in the Cost, Promotion, and Before columns to predict the percentage increase for each product based on the promotion. Because the test data included the revenue before and after the promotion, Watson learns from that data and is able to predict the impact of the promotion when the After data column is not available. The $N-Increase field is the prediction of the percentage increase based on the Neural Net model. Increase shows the actual increase in revenue and $N-Increase shows the prediction from running the neural network model. You can compare the actual increase with the predicted increase to see the accuracy of the neural net prediction. You can see in the screenshot that the prediction is very close for each product.

Task 2: Save a screenshot
NOTE: This step is optional for those auditing the course. The screenshot saved in this step will be required as part of the Graded Final Assignment for those pursuing a certificate for this course.
Take and save screenshots in .jpeg or .jpg format of the output of the model. Ensure the labels and confidence scores (the $N-Increase column) in the table are readable. See a sample screenshot above.
Task 3: Look at the Regression Tree model
Next, right click the bottom brown box called Increase, and click Preview.
Notice the field labeled $R-Increase. As with the Neural Net model, the bamount was created by the C&RT (Classification and Regression Tree) model and shows the predicted percentage increase in revenue based on running the promotion for each product.
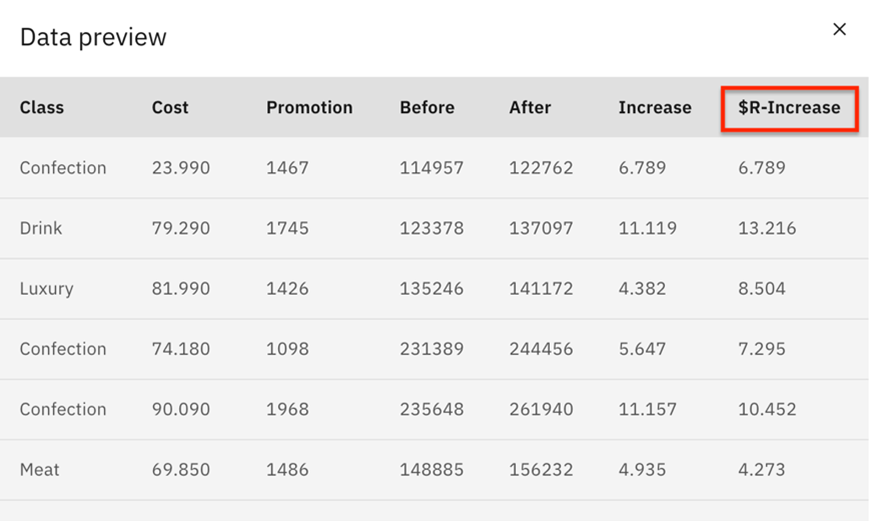
As with the neural net model, you can compare the Increase column and the $R-Increase column to see how accurately the regression model predicted the revenue increase.
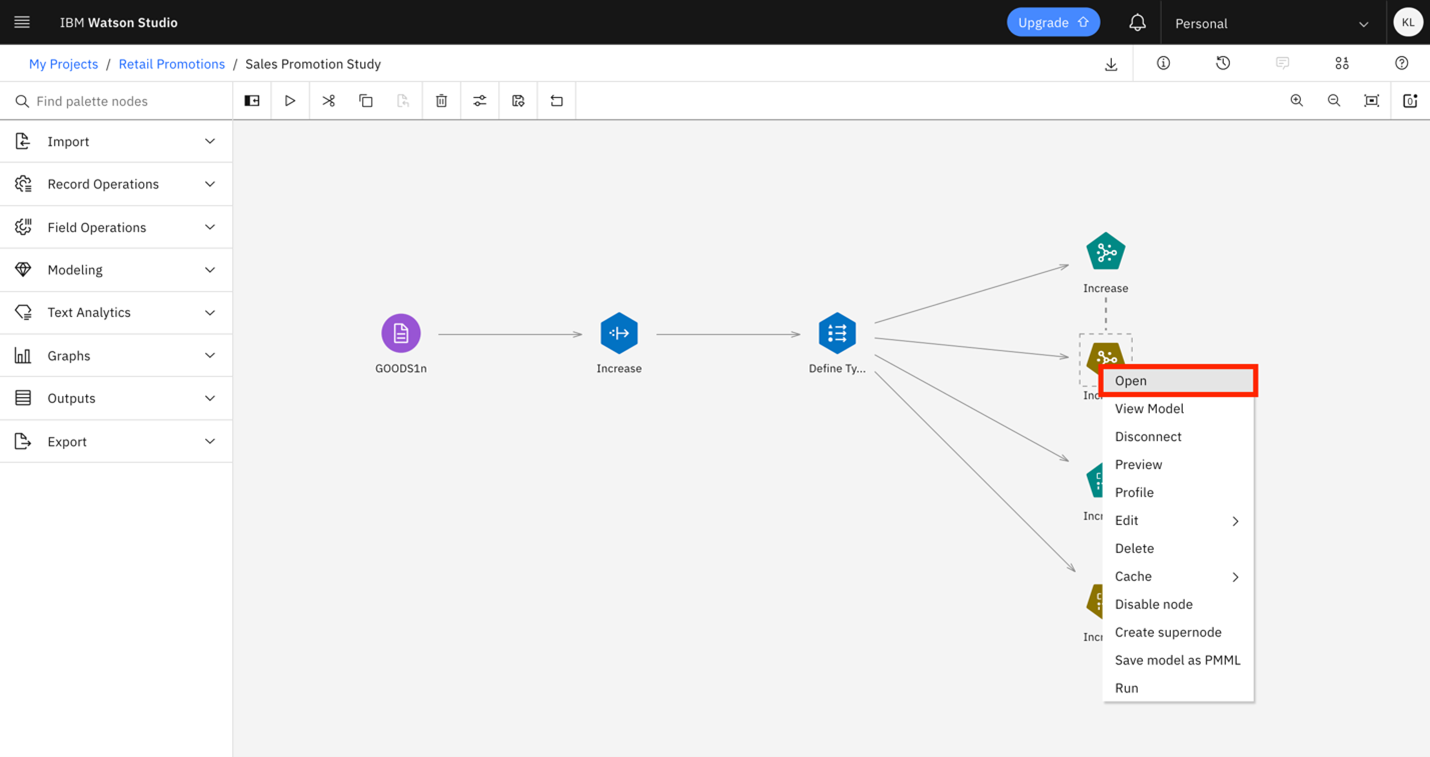
You should also right click each model and choose View Model to explore information about each of the models and their outputs. By examining the models, you can determine which is likely to give you greater accuracy in the prediction of percentage increases by running the promotions.
Task 4: Save a screenshot
NOTE: This step is optional for those auditing the course. The screenshot saved in this step will be required as part of the Graded Final Assignment for those pursuing a certificate for this course.
Take and save screenshots in .jpeg or .jpg format of the output of the model. Ensure the labels and confidence scores (the $R-Increase column) in the table are readable. See a sample screenshot above.
Answer the question: Which model has better accuracy each product and why?
Hint: Consider how neural networks and regression models process data and why they might produce different results.
Follow us on Twitter and send us some of your funniest and most interesting results you found with IBM Data Modeler Flow!
| Date | Version | Changed by | Change Description |
|---|---|---|---|
| 2020-09-07 | 2.0 | Arpita | Migrated Lab to Markdown and added to course repo in GitLab |
| 2021-01-06 | 3.0 | Srishti | Updated steps with present IBM cloud UI |
| 2021-01-27 | 4.0 | Arpita | Updated steps with present IBM cloud UI |
| 2021-08-07 | 5.0 | Simran | Updated steps with present IBM cloud UI |